
Dashboard Analytics
The Importance of Data Visualization
Data visualization is crucial in today's data-driven world because it transforms complex data sets into intuitive, visual formats that are easy to understand and interpret.
By using charts, graphs, and other visual tools, Zuant 3D helps to highlight trends, patterns, and insights that otherwise would be overlooked in raw data.
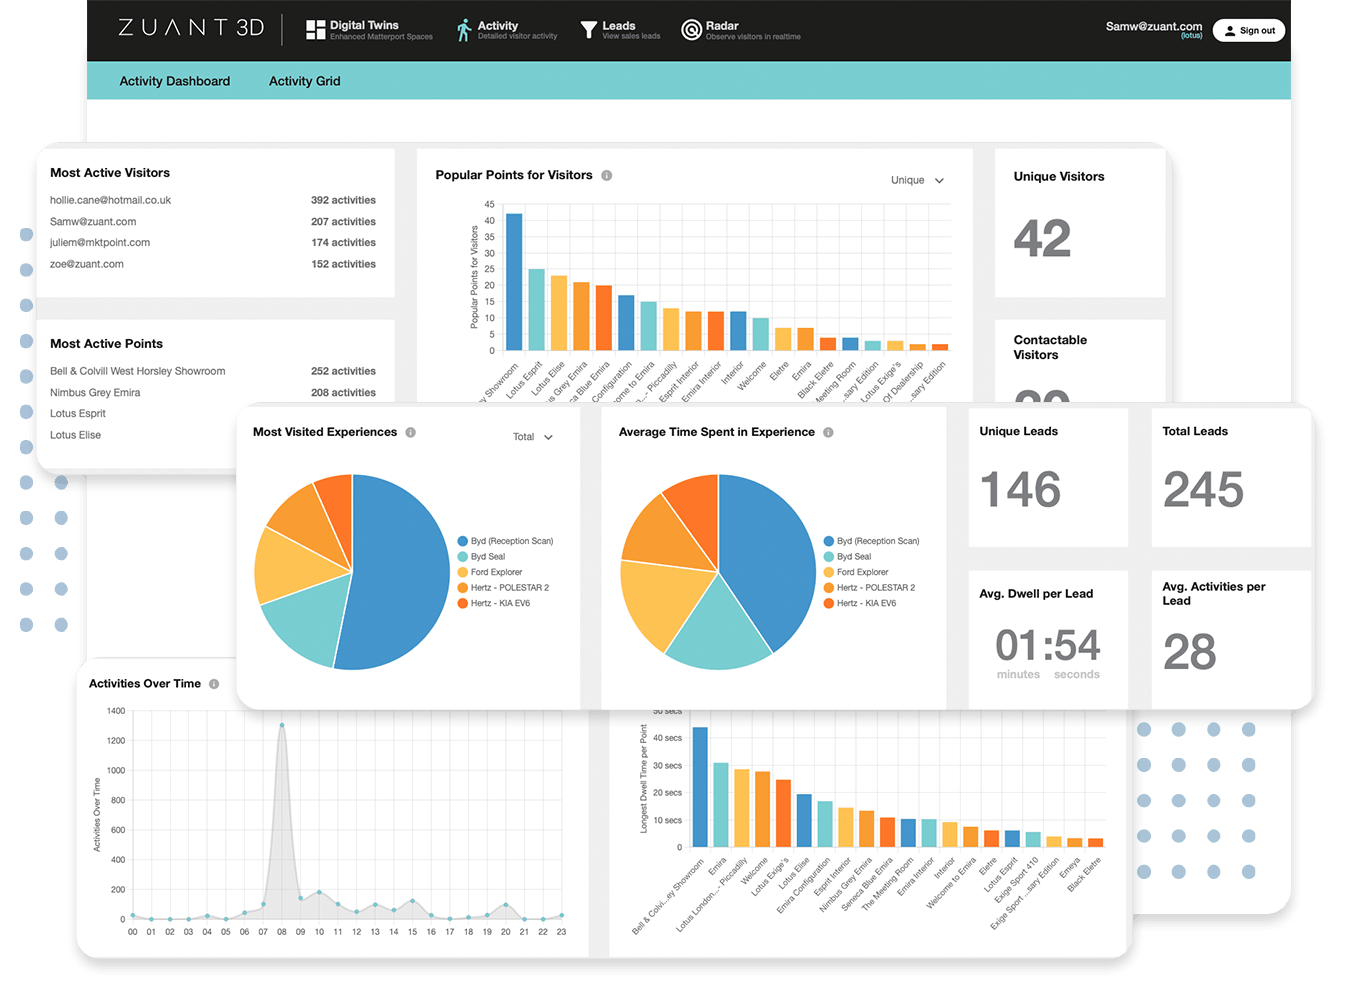
Backend Brilliance
A fully-fledged backend system that gives you a comprehensive overview of
each visitor, both graphically and in a list view. Such as:
-

Most Active Digital Twins Average
Dwell Time Per Lead -

Highest Dwelling Visitors
Leads Over Time -

Most Active Visitors
Average Activities per Visitor -

Experience Hotspots
Popular Points for Visitors -

Most Frequent Departure Points
Most Active Points
Dashboard Analytics FAQs
An Activity is simply a click from an end user within a Digital Twin. This may be moving from one point to the next, clicking on a piece of embedded content or a swivel of the camera. All of this is then recorded and reflected on your backend dashboard in a clear, easy-to-read format.
Yes. Zuant 3D comes equipped with a built-in filtering system allowing you to see exactly what you want to see. You can filter by Unique Visitors, Location and Date using either custom or a range of pre-selected parameters.